
The Australian Energy Market Operator (AEMO) released its 2026 Electricity Statement of Opportunities (ESOO) for the National Electricity Market (NEM) on 25 August 2026. The headline for ESOO 2026 is encouraging: the NEM has a materially stronger pipeline of grid-scale generation and storage, and for the first time since the Retailer Reliability Obligation (RRO) came into effect, AEMO is requesting no reliability instruments.1 The caveat is equally clear. Reliability over the ten-year outlook to 2035-36 is ‘highly dependent on timely delivery, operational availability, and the ability of resources to sustain supply during extended periods of system stress’.2
The ESOO is AEMO’s annual ten-year outlook of the investment needed to keep electricity supply reliable in the NEM. AEMO publishes it under clause 3.13.3A of the National Electricity Rules (NER), and its stated purpose is to provide technical and market data that informs the decisions of market participants, new investors and jurisdictional bodies as they assess opportunities in the market.3 It does this by forecasting demand, assessing the supply that is existing or sufficiently progressed, and measuring the resulting reliability against the standards set by the Australian Energy Market Commission’s (AEMC’s) Reliability Panel. Where a shortfall is forecast in the first one to four years, the ESOO also triggers formal action: AEMO may procure emergency reserves or request a reliability instrument under the RRO.4 The ESOO is not a plan. Unlike the Integrated System Plan, it does not identify an optimal development path; it identifies the additional supply needed if the specified projects, and nothing more, are delivered.5
For investors, developers, utilities and large energy users, the transition has moved from the question of whether enough capacity is in the pipeline to whether it will be delivered when it is needed. That is a project delivery problem as much as a policy or market one.
Two views of the same decade
Under the 2026 ESOO for the National Electricity Market (NEM), AEMO published two core reliability assessments.9 The Government Schemes and Actionable Developments assessment assumes on-time delivery of committed and anticipated projects plus government-backed developments, actionable transmission and coordinated consumer energy resources (CER). On that basis, reliability remains within the standard until 2033-34 in New South Wales, South Australia and Victoria, and 2034-35 in Tasmania.10
The stricter Committed and Anticipated Developments assessment, the one that drives AEMO’s regulatory reliability forecast, includes only projects meeting AEMO’s commitment criteria and applies recently observed commissioning delays.11 Under that lens, the reliability standard is forecast to be exceeded from 2030-31 in New South Wales and Victoria, 2031-32 in South Australia, 2032-33 in Queensland and 2033-34 in Tasmania.12
‘Committed’ has a specific meaning here. Through its quarterly Generation Information survey, AEMO assesses every proposed project against five commitment criteria: land (site secured), contracts for major components, planning approvals, finance and construction.13 A project is classed as committed only when all five are met, as anticipated when it has made progress towards at least three, and as in commissioning once at least 30 per cent of its capacity has commissioned.14 Everything else is proposed, and proposed capacity, however large (around 325 GW at the July 2025 count), plays no part in the reliability forecast.15 The classification is AEMO’s proxy for delivery confidence, and the delay assumptions reflect how committed projects have actually performed.
The gap between the two core reliability assessments is essentially the delivery risk sitting in the system. The stricter assessment carries around 40 per cent less capacity on average over the next five years, and new investment plateaus after 2031-32.16 AEMO’s delay assumptions are also instructive: committed projects are assumed to slip six months beyond the developer-advised commissioning date, and anticipated projects to the later of 1 July 2028 or one year beyond advised dates.17
The pipeline has grown substantially
Approximately 9.1 GW of new developments reached full output in 2025-26, more than double the capacity connected the year before.18 Since the 2025 ESOO, around 24 GW of newly committed and anticipated projects have entered the pipeline, taking total committed and anticipated capacity to 40 GW, more than half the NEM’s current installed capacity.19 A further 33 GW or so of publicly announced projects have been awarded government investment support.20 Against that, AEMO’s media release notes around 15 GW of coal and gas generation is scheduled to retire over the decade, while consumption is forecast to grow by more than 40 per cent.21
Behind the meter, the federal Cheaper Home Batteries Program has added 2.4 GW/7.4 GWh of household batteries since 1 July 2025, and for every 1 MW of rooftop PV installed in the past year, households added 2.5 MW/7.7 MWh of storage across the NEM.22
How the 2026 ESOO compares with 2023, 2024 and 2025
Read in isolation, each ESOO is a snapshot. Read together, the last four editions tell a more instructive story about how the outlook, and AEMO’s method for assessing it, have moved.
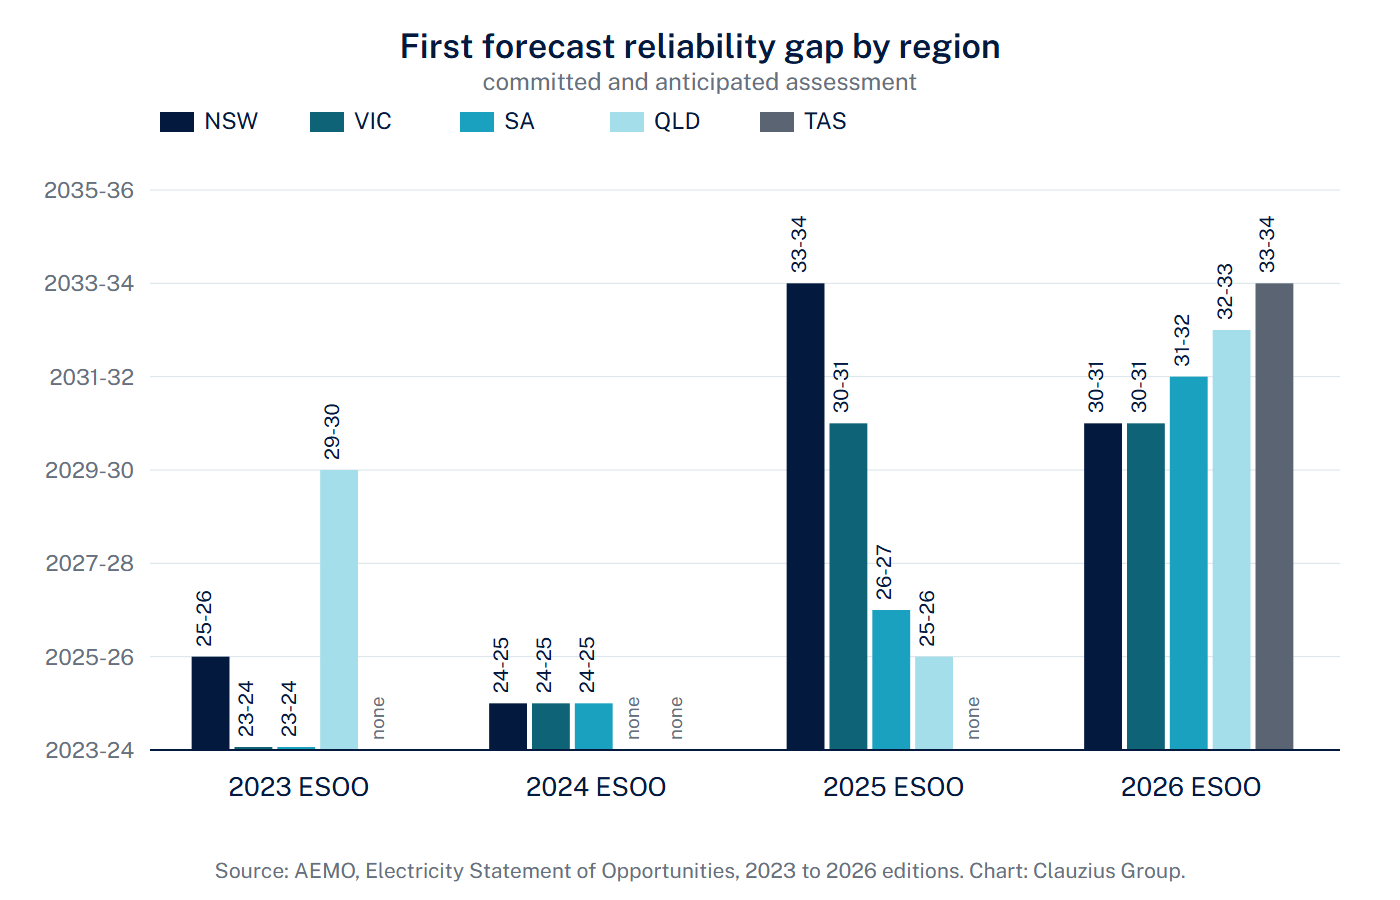
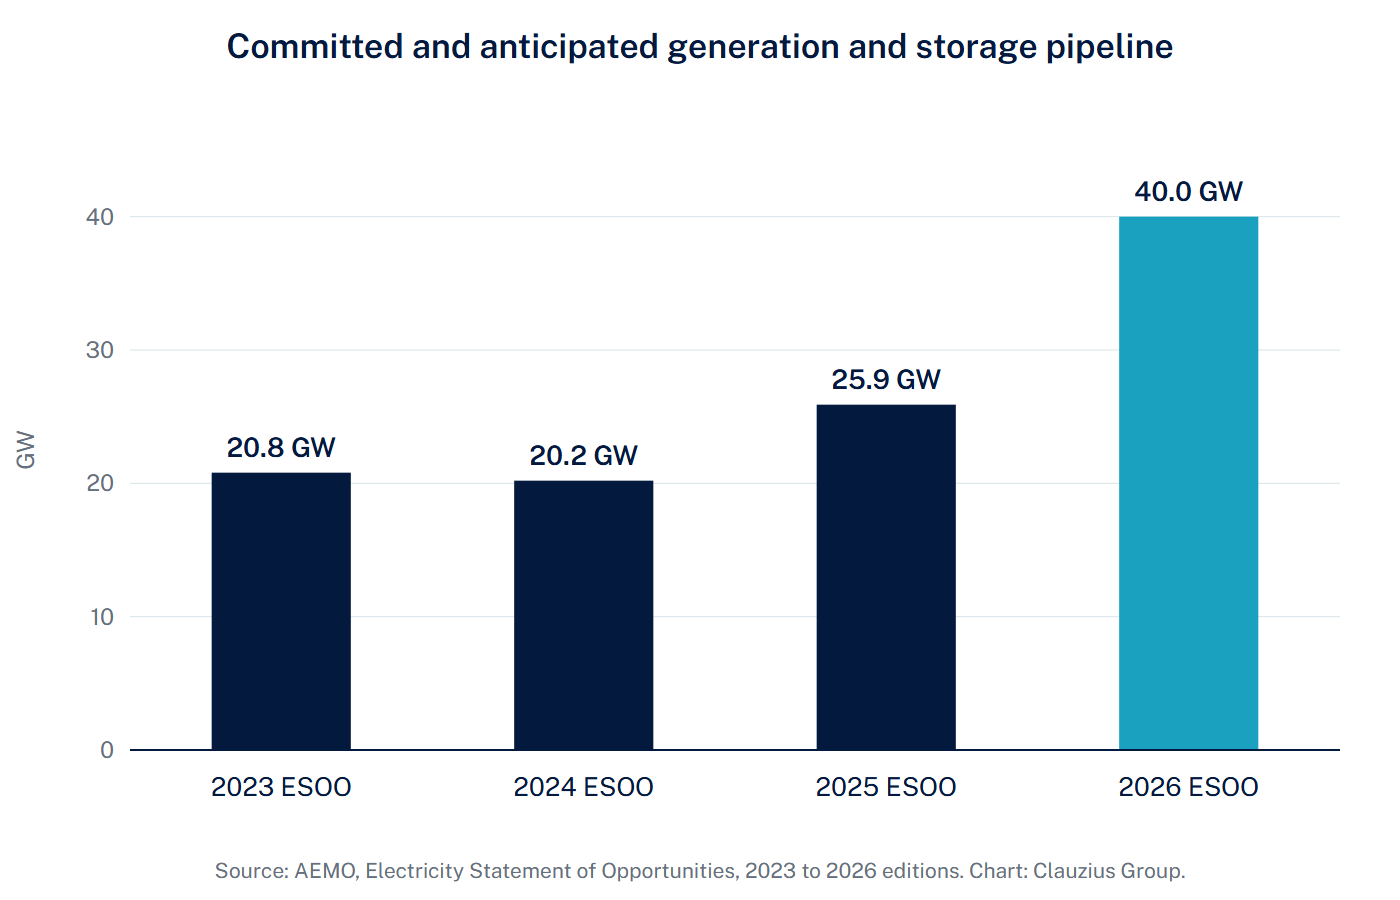
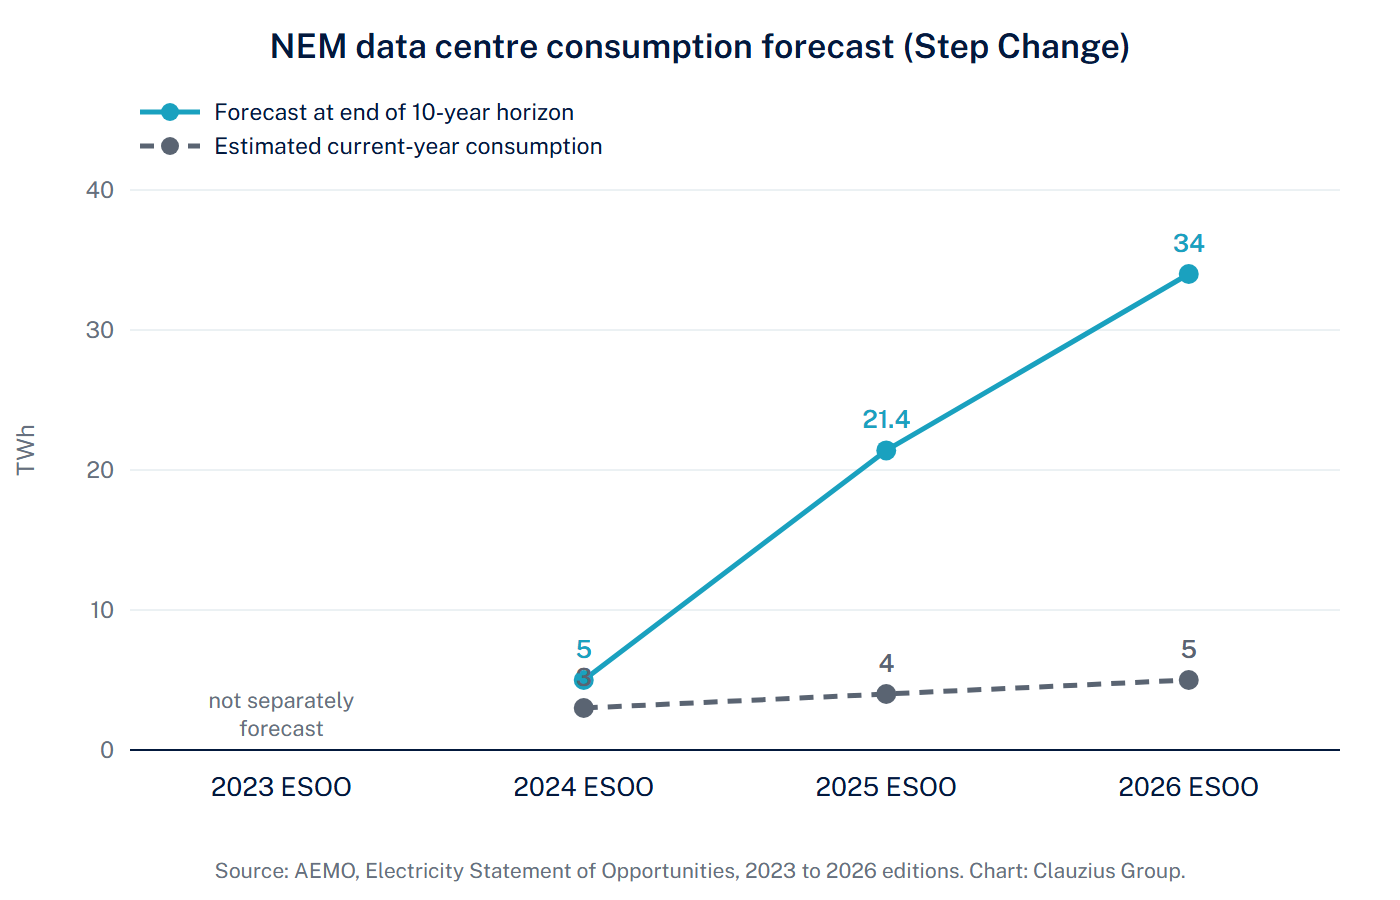
| Description | 2023 ESOO | 2024 ESOO | 2025 ESOO | 2026 ESOO |
|---|---|---|---|---|
| First forecast gap, NSW | 2025-2623 | 2024-2524 | 2033-3425 | 2030-3126 |
| First forecast gap, VIC | 2023-2427 | 2024-2528 | 2030-3129 | 2030-3130 |
| First forecast gap, SA | 2023-2431 | 2024-2532 | 2026-2733 | 2031-3234 |
| First forecast gap, QLD | 2029-3035 | None | 2025-2636 | 2032-3337 |
| First forecast gap, TAS | None | None | None | 2033-3438 |
| Committed and anticipated pipeline | 20.8 GW39 | 20.2 GW40 | 25.9 GW41 | 40 GW42 |
| Data centre consumption, end of horizon | Not separately forecast | ~5 TWh (2033-34)43 | 21.4 TWh (2034-35)44 | ~34 TWh (2035-36)45 |
| RRO instruments requested | T-3 NSW and VIC, 2026-2746 | T-3, NSW and VIC, 2027-2847 | T-1, SA, 2026-2748 | None49 |
Gap years are from the committed and anticipated (or “Central”) assessment used for RRO purposes in each edition. Pipeline figures are committed plus anticipated generation and storage capacity as reported in each ESOO.
The improvement is real, and it has two main causes. The first is investment. The committed and anticipated pipeline was essentially flat between 2023 and 2024 (20.8 GW to 20.2 GW), then rose by roughly 5 GW in 2025 and a further 14 GW in 2026.50 Commissioning has accelerated in step achieving 4.4 GW in 2024-25 was itself a record, and 2025-26 more than doubled it.51 The second is retirement timing. The 2023 ESOO modelled Eraring closing in August 2025.52 Origin’s two-year extension to August 2027 removed the New South Wales gaps forecast for 2025-26 and 2026-27 in the 2024 edition.53 AGL’s in-principle agreement to extend Torrens Island B was flagged in the 2025 ESOO as sufficient to remove the South Australian gap,54 and the 2026 forecast no longer identifies it.
But the year-on-year comparison is not clean. Three methodological shifts complicate it. The 2023 ESOO was itself a step change in conservatism: AEMO introduced explicit delay assumptions for new projects, reduced its assumed level of CER orchestration to current levels, and adopted higher generator unplanned outage rates, all of which pushed gaps earlier than the February 2023 update had suggested.55 The 2025 and 2026 editions then added fuel and energy limits, planned and maintenance outages and more weather reference years (from 13 in 2023 to 24 in 2026).56 Most importantly, the 2026 regulatory forecast includes around 26 GW of anticipated projects that have reached fewer milestones than committed ones. AEMO is candid that, had they been excluded, T-3 instruments would have been requested for Queensland and New South Wales for 2029-30 following the closure of Gladstone and Eraring power stations.57 Consequently, due to the nature of the RRO framework, as T-3 reliability instrument is not requested, T-1 reliability instrument cannot be requested if the 26 GW anticipated projects pipeline slips.58 Independent commentators have observed that the framing of each ESOO has shifted between assessments over the years, which makes headline comparisons less meaningful than the underlying data.59
The reliability standard itself is about to move. The AEMC’s Reliability Panel published its final 2026 Reliability Standard and Settings Review on 23 April 2026, recommending that the standard be relaxed from 0.002 per cent to 0.003 per cent expected unserved energy for 1 July 2028 to 30 June 2032, equivalent to roughly 16 rather than 10 minutes of generation-driven outage per customer per year, while retaining current market price settings.60 The Panel’s reasoning was that open-cycle gas turbine costs have risen while the value customers place on reliability has fallen.61 AEMO applied the current 0.002 per cent standard in the 2026 ESOO because the rule change is incomplete, but notes the timing of forecast gaps would be the same under 0.003 per cent.62 A relaxed standard will not change when gaps appear; it may widen the distance between what the ESOO signals and what operators need to do in real time.63
Demand, and particularly data centre demand, is the least stable variable. The 2024 ESOO forecast around 5 TWh of data centre load by 2033-34 from committed projects, with a further 10 TWh in a sensitivity.64 The 2025 edition, with a dedicated data centre segment, lifted the central forecast to 21.4 TWh.65 The 2026 edition lifts it again to around 34 TWh, or 13 per cent of operational consumption, despite reporting that around 36 per cent of projects on the 2025 list have since been cancelled, including more than 30 per cent of those previously classed as committed.66 AEMO considered 225 projects and applied probability weightings to reflect attrition,67 but a forecast that has grown nearly seven-fold in two editions should be read as a range, not a point. The upside and downside both carry reliability consequences.
Where the risk concentrates
Wind and gas pathways remain less certain than solar and storage. AEMO notes that project economics, contracting, transmission access, approvals, community acceptance and connection requirements can all affect whether wind projects reach financial close and enter construction on anticipated timeframes.68 Gas generation is important during extended low wind and solar periods, but new gas plant may depend on complementary fuel and infrastructure investment that no single proponent can deliver alone.69
Winter is becoming the binding season. Electrified heating is pushing winter demand growth ahead of summer, at a time of year when solar output is lowest.70 Underlying consumption is forecast to rise from 204.2 TWh in 2025-26 to 308.4 TWh by 2035-36.71
AEMO also flags that reliability depends on ageing coal generators remaining available until their announced closure dates,72 and that an El Niño event is firmly established ahead of the 2026-27 summer.73
What this means for project owners and investors
The 2026 ESOO is, at its core, a statement about execution. The policy support and market drivers are largely in place; the reliability outcome now turns on capital deployment, connection timing, commissioning performance, contracting discipline and the availability of the assets that get built. The four-year trend shows that the outlook improves when projects reach financial close and when closures are deferred, and deteriorates when AEMO tightens its assumptions to reflect what has actually been delivered. For anyone with capital deployed in the NEM, the practical questions are whether the schedule is credible, whether delay risk is priced and allocated, and whether the project has the commercial, contracting and technical structure to hold its commissioning date when the supply chain, approvals or grid connection push back.